 Advancing from type 1 turbines with a squirrel-cage generator to a doubly fed induction generator (DFIG) was a great step, as it allowed much better wind power grasp. The ability to take part of the generated power from the rotor through power converters made it possible for a wind turbine to benefit from a large proportion of the available, otherwise lost, energy in winds with higher speed. Also, in order to lower the cut-in speed from about 5 to 3–3.5m/s, it was decided to run a turbine at sub-synchronous speed. This called for switching of the roles in the back-to-back converters. This arrangement has been traditionally continued to all the later and larger turbines.
By Ahmad Hemami, McGill University, Montreal, Canada
Noting the reliability problem with power converters, especially when handling larger powers, the question can be asked whether having back-to-back converters to switch from rectifier to inverter is really worth it, or can it make them more susceptible to early failure? According to personal conversations with the managing director of a company in the wind turbine maintenance business, 60% of the company’s repairs are on power converters. In a previous article (Windtech International, Vol 17, No. 4) I pointed to the fact that, as studies show, power converters have some reliability issues. In such case, it is more advisable to minimise the possible sources of stress on these components.
 When a converter fails it is most likely unexpected, but even if it is expected it takes more than one day of downtime for its repair/replacement.
In this study, it is shown that the additional power production in the range of wind speeds between 3 and 5m/s in a turbine equipped with a DFIG and operating at variable speed is less than 1% of the production of the turbine. For this study, a 3MW turbine is considered to work in two typical onshore wind regimes, with 7 and 8m/s average wind speeds. Since no actual data for the turbine performance curve is available from the manufacturer, reasonable simulated data is used, which confidently represents a typical turbine. Also, for the wind regime, Weibull model data is employed, which is widely acceptable.
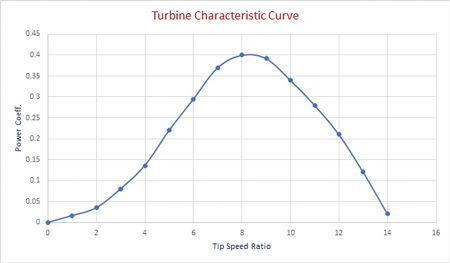
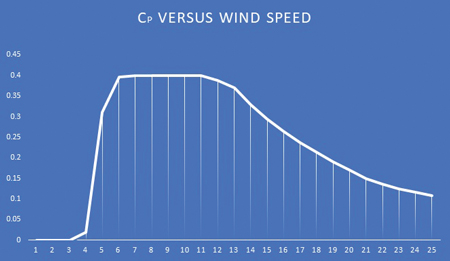
Figure 1 shows the performance curve of the turbine. The turbine rotor has a diameter of 100 metres and the cut-in and cut-out speeds are 3 and 24m/s, respectively. For wind speeds smaller than 5m/s the turbine rotates at 8rpm (tip speed = 41.9m/s) and for wind speeds larger than 11m/s it rotates at 16rpm (tip speed = 83.8m/s). For 5 < v < 11m/s the rotation speed is optimised accordingly for the best tip speed ratio (l = 8). Figure 2 shows the power coefficient versus wind speed for a turbine operating at variable speed.
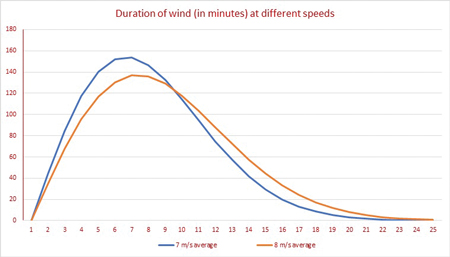 Figure 3 shows the duration of wind (in minutes) for different speeds during a 24-hour period for wind regimes with 7 and 8m/s average wind speed. Some of the computational results are summarised in Table 1, indicating the daily energy production for wind regimes with average speeds of 7 and 8m/s. Column 3 shows the portion of generated energy for wind speeds between 3 and 5m/s. The percentage of this energy relative to the total is shown in column 4. In both cases, the numbers are less than 1%. However, noting that at this range of wind speeds a wind turbine (with DFIG) operates in a sub-synchronous condition, the true production is smaller than depicted.
The last column in the table is the equivalent number of days for the yearly production for this portion of wind speeds (3–5m/s) based on 300 days, assuming 60 no-wind days and 5 maintenance and forced outage days.
We observe that in a turbine with a DFIG, one mode of operation counts for less than 1% of production. Also, from a control perspective, additional hardware may be associated with the switching capability. If this switching between sub-synchronous and super-synchronous operation puts extra stress on these components and makes them more vulnerable to failure, a possibly overlooked question arises. Is it worthwhile to work in two modes or is it better for the converters to always work in one mode?
| Wind (average, m/s) | Daily energy (MWh) | 3–5m/s portion (kWh) | % ratio | Equivalent number of days per year |
| 7 | 23.55 | 228 | 0.97 | 2.90 |
| 8 | 28.97 | 190 | 0.66 |
1.97
|
Table 1. Summary of energy calculation


